Obesity Trends Among U.S. Adults Between 1985 and 2010

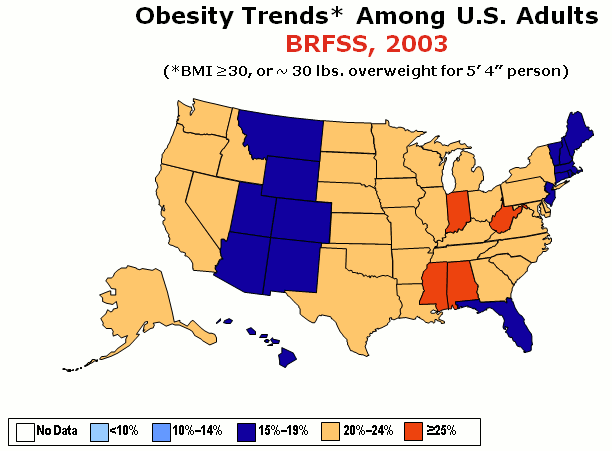
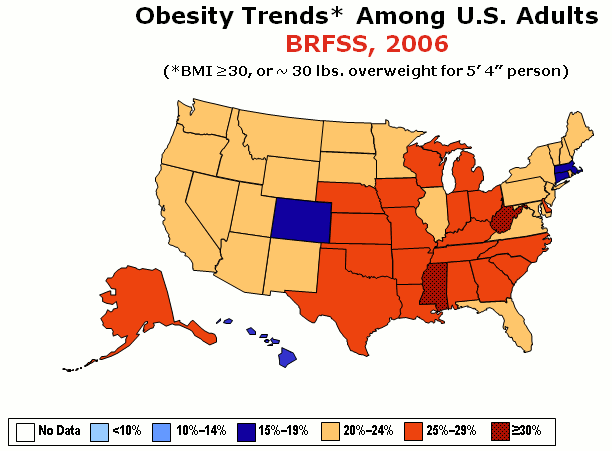
Each year, state health departments use standard procedures to collect data through a series of telephone interviews with U.S. adults. Height and weight data are self-reported. The following images show obesity trends, which is far worse than being ‘just’ overweight.
- Body Mass Index (BMI): A measure of an adult’s weight in relation to his or her height, specifically the adult’s weight in kilograms divided by the square of his or her height in meters. Click here to calculate your own BMI.
- Overweight: BMI of 25-29.99
- Obese: BMI of 30+.
Onto the photos!
Note that as time goes by it gets so bad that they have to keep adding new categories. We start with 1985…


Well, that escalated quickly.
In 1990, no state had a prevalence of obesity greater than 15%.
By 2010, no state had a prevalence of obesity less than 20%.
There are many reasons for this including…
An aging population: All the baby boomers who were young adults in the 80’s are now old and fat.
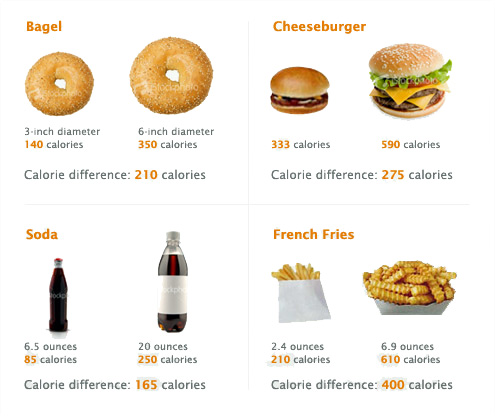
Portion Distortion: Portions are getting larger and larger and larger! Not just at restaurants but everywhere! The bottles are larger, the bagels are larger and so forth. Many foods and drinks served as a single portion actually contain multiple servings. Compare the difference in serving size (and calories) of some food and drinks 20 years ago versus today:

In fact, food portions have increased so much that we are throwing away more food than ever! Forty percent of the food in the U.S. today goes uneaten, which means Americans are throwing out the equivalent of 165 billion – with a B – billion dollars worth of food each year.
Other interesting tidbits?
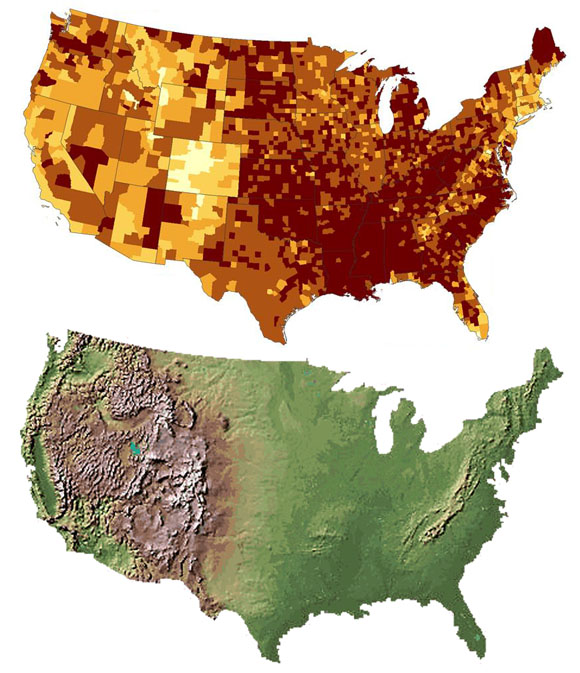
A study recently revealed that there was a very strong association between Obesity and Altitude. The higher in elevation you live, the less likely you are obese. Why? Well we aren’t sure why. Correlation doesn’t equate to causation, but it’s interesting nonetheless.


